
How to Calculate Break-Even on Restaurant Technology Costs
A restaurant reaches technology break-even when the added contribution covers the system’s cost, leaving profit unchanged by the investment. Calculating break-even on restaurant technology means treating recurring subscription costs as fixed expenses, then dividing them by the contribution margin ratio to find the sales needed to cover them. You can then convert that target into daily and per-seat goals in AED.
It’s easy to focus on a software fee alone, but the more useful question is how much additional contribution the technology needs to support. That depends on variable costs, trading days, guest spend, and available seats. A target based on your actual operating figures is more useful than a general promise of efficiency.
This guide walks through the calculation: identify the relevant technology costs, work out your contribution margin, and translate the result into daily sales and per-seat targets for a UAE restaurant. It also explains how to judge whether the result is a realistic operating goal, not just a figure on a spreadsheet.
Key Takeaways
- Separate fixed costs from costs that rise with sales to build a break-even calculation that reflects how your restaurant operates.
- Use the contribution margin to translate technology costs into the sales or order volume needed to cover them.
- Convert your break-even sales figure into daily and per-seat targets using your operating schedule and seating capacity.
- Include recurring software subscriptions in fixed costs, then review how changes in sales, menu mix, or operating costs affect the target.
- When disconnected POS and food-aggregator systems make performance harder to track, OmniSync can connect them to support a clearer view of operations.
What is the Break-Even Point?
At break-even, sales contribution exactly covers expenses, so profit is zero. For a UAE restaurant, calculate the target in both AED and units to understand the revenue and sales volume required.
-
Define Break-Even in Dollars and Units
First, distinguish the sales target from the order target. Break-even sales revenue is the AED amount needed to cover fixed expenses after variable costs. Break-even units show how many meals, orders, or covers must contribute toward those expenses. These figures answer different questions, so track both rather than treating revenue alone as proof of progress.
For a technology investment, define units consistently, such as completed orders or seated guests. Choose a measure your sales records can track reliably.
-
Apply the Restaurant Break-Even Formula
Calculate the contribution margin ratio by subtracting variable costs from sales, then dividing the result by sales. To find break-even sales, divide fixed costs by the contribution margin ratio. To find break-even units, divide fixed costs by contribution per unit. These calculations show the sales or units required before profit begins.
Include recurring technology costs in fixed expenses when they do not vary with sales. Make sure the variable-cost percentage and sales figure use the same basis.
-
Determine the Break-Even Date
Estimate the break-even date by dividing the break-even point by forecast turnover, then multiplying by 365 days. This expresses how many trading days the restaurant may need before becoming profitable. Use expected revenue across a twelve-month trading year, not a single unusually strong period.
Review the estimate regularly and after a significant business change. If actual turnover differs from the forecast, update the inputs and recalculate your break-even point.
-
Compare Technology Costs and Benefits
Compare costs and benefits against your restaurant’s size, service style, order channels, and transaction volume. A smaller venue may value reduced manual work differently from a larger operation processing more orders. For each option, compare total cost of ownership, including recurring and setup costs, with the measurable contribution it could support. Divide the investment by expected contribution to estimate how long break-even may take.
Compare options using the same cost categories, time period, and benefit assumptions. Account for risks such as staff adoption, system fit, downtime, or weaker sales growth, all of which can delay break-even. For UAE VAT, payment-processing fees, and local compliance costs, apply consistent VAT treatment and record charges in the appropriate expense category. Not all costs behave the same way.
Technology costs and benefits vary by restaurant size, service model, order volume, and workflow. Assess each option against the costs and measurable benefits that matter to your operation.
Compare technology vendors by assessing total ownership costs against expected contribution. The resulting break-even time shows how long the investment may take to cover its costs.
Underuse, staff adoption problems, poor system fit, interruptions, or lower-than-expected sales can delay or prevent break-even. Include these risks in your assumptions and monitor actual results.
Apply consistent VAT treatment in your accounts, and include payment-processing fees and local compliance costs in the appropriate expense categories. Their effect on the calculation depends on how and when they are incurred.
Daily sales and per-seat break-even targets
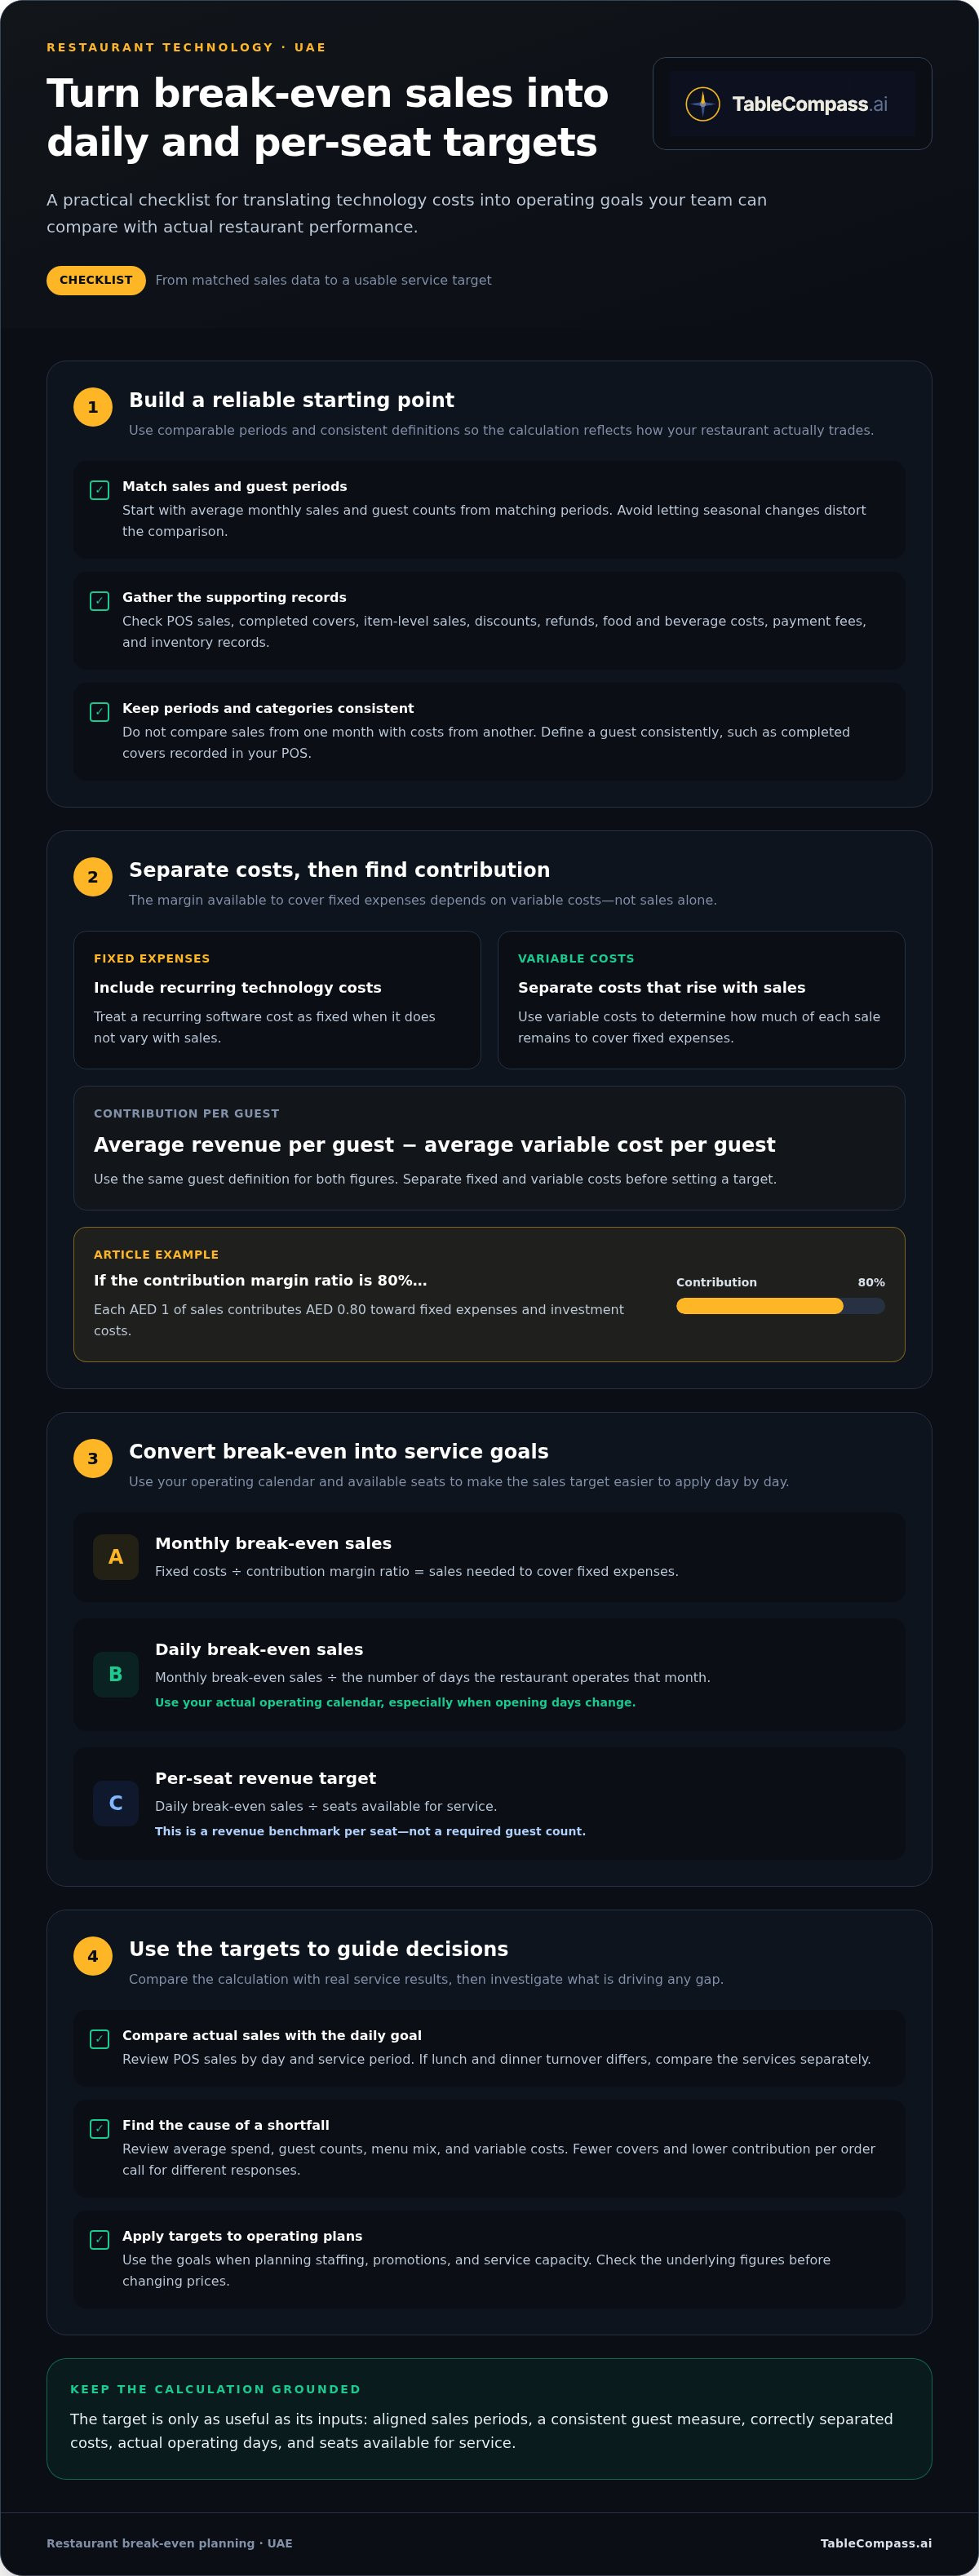
Build the analysis using technology costs, variable costs, sales revenue, operating days, guest counts, and usable seats. Calculate the contribution needed to cover the investment, then convert it into daily and per-seat targets.
- Gather sales and guest data for matching periods from your POS reports. Start with average monthly sales and guest counts, comparing like periods so seasonal changes don’t distort the figures. Add item-level sales, discounts, refunds, food and beverage costs, payment fees, and inventory records. Together, these help show whether increased revenue brings enough contribution to cover expenses.
Keep sales periods and accounting categories consistent. Don’t compare a sales report for one month with costs from another period.
- Calculate contribution per guest by subtracting average variable cost per guest from average revenue per guest. Use the same guest definition in both figures, such as completed covers recorded in your POS. If an 80% contribution margin ratio applies to your forecast, each dirham of sales contributes د.إ0.80 toward fixed expenses and investment costs.
Separate fixed and variable costs before setting the target. Otherwise, the calculation may overstate the margin available to cover technology.
- Convert monthly break-even sales into a daily goal by dividing the amount by the number of days the restaurant operates that month. Use your actual operating calendar, especially if opening days change. Compare the daily target with POS sales by day and service period.
For a per-seat target, divide daily break-even sales by the number of seats available for service. This gives a revenue benchmark per seat, not a required guest count. If turnover differs between lunch and dinner, compare the services separately.
- Use these targets to plan staffing, promotions, and service capacity. If daily sales fall short, review average spend, guest counts, menu mix, and variable costs before changing prices. A shortfall may come from fewer covers or lower contribution per order, and each cause requires a different response.
Compare actual results with your targets regularly. Record technology-related changes, such as fewer order errors or additional direct orders, only when operating data can demonstrate them. This keeps the analysis grounded in observed results rather than assumed benefits.
When sales and guest figures are spread across operational records, keep the break-even review connected to broader restaurant operations planning.
Restaurant software subscriptions as a fixed cost
List every technology expense before updating your restaurant’s break-even analysis. Include recurring subscriptions, setup, hardware, and staff training, then classify each cost by how and when it occurs.
-
Classify Software Subscriptions as Fixed Costs
Record a recurring software subscription as a fixed cost when the charge stays stable regardless of sales volume. Restaurant technology subscriptions and reservation tools belong in the expense list because they recur even during quiet services. Check billing terms and separate usage-based charges, which may increase with orders or transactions.
A reliable break-even calculation depends on keeping cost categories distinct. A monthly subscription belongs with fixed costs; a transaction charge belongs with variable expenses. If a software package combines both, split the charges according to the billing details rather than counting the full amount twice.
-
Include Setup, Hardware, and Training Costs
Add setup, hardware, subscriptions, and training to the technology investment record. Separate one-time launch expenses from recurring charges so the calculation reflects both initial and ongoing costs. Treat hardware as an investment cost, not a software subscription.
Record staff training time and any paid training expense consistently. If team members need instruction before using a new system, include the associated cost rather than assuming adoption requires no effort. Don’t add equipment costs to a software fee if they are already included elsewhere in your accounts.
- Choose a time period that matches your decision. For ongoing operating break-even, include subscriptions in the period when they are charged. For a full investment review, include one-time setup, hardware, and training costs in the same analysis period as expected benefits. State your method clearly so later comparisons use the same basis.
Next, calculate the contribution needed to cover technology costs. Divide fixed technology expenses by the contribution margin ratio to estimate the required sales revenue. If you’re assessing a one-time investment, include its cost in the total to be recovered. Revenue is not contribution: variable expenses reduce the amount available to cover fixed costs.
Review the ledger for existing technology charges before adding a new system. Check whether a subscription replaces an old tool or adds another expense. Removing a duplicated service can reduce net costs; keeping both means counting both. This ties your break-even calculation to actual expenses, not just a product list.
After implementation, compare planned costs with actual invoices and payroll records. Update the analysis when subscription terms, staffing needs, or equipment requirements change. A clear record of recurring and one-time expenses makes the required technology contribution easier to understand and keeps future investment decisions consistent.
Break-even calculation
Use sales, fixed expenses, and variable-cost rates from the same accounting period. The formula turns these inputs into a clear revenue target in AED for a UAE restaurant.
- Set the calculation period and collect sales and expenses for that period. Use monthly figures together or choose another consistent timeframe. Separate fixed expenses from variable costs, such as food costs, hourly labour, and payment-processing fees. Include the technology expense in fixed costs if it recurs independently of sales.
Check that inventory costs reflect what was used during the period, not simply what was purchased. Otherwise, food costs may look unusually high or low compared with sales, distorting the calculation.
- Calculate the variable-cost percentage by dividing total variable costs by total sales. For example, if variable costs equal 35% of sales, the contribution margin ratio is 65%. That remaining share of revenue contributes toward fixed expenses and profit. Use your own records for the percentage; a sample rate is not a substitute for the restaurant’s actual cost mix.
Include costs that change with each order in the variable-cost total. If food costs are 40% of the selling price in a menu example, account for that share before calculating the contribution available from each sale.
- Calculate break-even sales by dividing fixed costs by one minus the variable-cost percentage. In symbols, break-even sales in AED = fixed costs in AED ÷ (1 − variable-cost percentage). With a 35% variable-cost rate, divide fixed costs by 0.65. The result is the sales revenue needed to cover fixed and variable expenses, before the restaurant records profit.
For a technology investment, include its recurring expense in the fixed-cost total. The formula then gives the full sales target, including the technology, rather than isolating its fee from other obligations.
- Calculate unit break-even when you know the average selling price and variable cost per unit. Subtract variable cost per order from its selling price to find contribution per order, then divide fixed costs by that contribution. Use the same unit throughout, such as meals, completed orders, or covers, and don’t mix them.
Check the result against your restaurant’s menu mix. Dishes can have different food costs and contributions, so an average order may hide low-margin items. If the mix varies, use a weighted average based on actual sales.
- Test your assumptions by changing one input at a time. Try a higher food-cost share, lower sales, or a different technology expense, then recalculate the target. This shows which cost most affects break-even and where tighter inventory tracking or menu decisions could improve contribution.
Compare each result with recorded sales from the same period. If actual revenue falls short of the calculated target, review the cost assumptions before changing the formula. Accurate inputs make break-even analysis a practical operating tool, not just an estimate.
Restaurant break-even calculation
To assess technology’s effect on break-even, distinguish changes associated with the investment from normal sales fluctuations. A like-for-like comparison helps show whether new workflows are improving the operating result.
-
Calculate the Restaurant Break-Even Point
Set a baseline before judging the investment. Use POS and accounting records from comparable trading periods, and note promotions, menu updates, changed opening hours, or unusual events in the UAE market. These factors can affect sales independently of the technology.
Keep the baseline and review periods consistent in channel mix and service pattern. If they differ, note and account for the difference in your interpretation rather than attributing every change to the investment.
-
Apply the Calculation to Technology Investments
When calculating break-even on restaurant technology, identify the specific operational change the investment is meant to support. For example, measure order accuracy, time spent correcting entries, or the share of orders processed through each channel. Choose measures staff can record consistently.
Compare those measures with the baseline, then link verified changes to sales or expenses in your records. Don’t assign a financial value to an improvement unless accounting data shows how it affects actual results.
- Separate direct effects from wider business changes. If sales rise after a system launch, review promotions, menu changes, seasonality, and channel mix before attributing the increase to technology. A brief written log of operational changes gives restaurant owners and managers context when reviewing results.
Use a simple comparison sheet listing the measure, period, source record, and observed change. For example, note whether staff report fewer order corrections, then compare that feedback with recorded voids or corrected tickets. This adds practical evidence without treating staff feedback alone as a financial gain.
- Set a review schedule that fits the rollout and your restaurant’s trading patterns. Check results after staff have had time to use the new workflow, and record implementation changes. If use varies across shifts, compare those shifts separately before drawing an overall conclusion.
Use your findings to decide whether to continue, adjust the workflow, or revisit the investment assumptions. A disciplined approach to calculating break-even on restaurant technology ties the decision to measurable operating evidence, not a single busy week or isolated sales result.
For a restaurant assessing connected workflows, explore restaurant technology options as part of its operational review.
TableCompass.ai: OmniSync
TableCompass.ai’s OmniSync connects restaurant POS systems with food aggregators, bringing order channels into a more coordinated workflow. It may be relevant when disconnected systems make sales tracking and assessment of a technology investment difficult.
For a UAE restaurant, break-even still depends on your own costs, sales mix, and operating data. OmniSync addresses the systems connection. TableCompass.ai also offers Atlas Menu Management for centralized menu control, GuestConnect AI for automated customer interactions, and a White-Label App for direct ordering.
Consider these tools when their supported workflows match your operational goals, then compare their costs with measurable business outcomes. To discuss how TableCompass.ai can support your restaurant’s operations, contact TableCompass.ai.
Turn Your Break-Even Analysis Into the Next Decision
Use your break-even model as a working decision tool, not a one-time spreadsheet. As your UAE restaurant changes its menu, order channels, or routines, update the assumptions and compare actual results with expected outcomes. This keeps calculating break-even on restaurant technology connected to real operating decisions rather than treating software as an isolated expense.
When disconnected systems complicate the analysis, TableCompass.ai’s OmniSync connects restaurant POS systems with food aggregators. Atlas Menu Management centralizes menu control, while GuestConnect AI automates customer interactions. Choose the option that fits the operational gap you’re addressing, and use your sales and cost records to assess its role in your plans.
For a conversation about your restaurant’s technology needs, contact TableCompass.ai to discuss your needs. A clear next step can help you make decisions with greater focus and build a more connected operation.
Frequently Asked Questions
How can technology help reach break-even faster?
Technology can support faster break-even by reducing avoidable work and helping staff act on accurate operating information. For example, compare order corrections, stock mismatches, and time spent re-entering orders before and after a system change. Track the effect on labor use and contribution, not just the number of tasks automated. Keep sales mix and trading conditions in view, so ordinary business changes aren’t mistaken for technology-driven gains.
How does average order value affect break-even?
A higher average order value can reduce the number of orders needed to cover fixed costs, but only if contribution also rises. Compare average-order revenue with variable costs, including ingredients and transaction charges. An add-on that lifts the bill but also carries substantial costs may add little contribution. Review order-level data by menu mix to see whether higher spending increases the amount available toward break-even.
How long does it take a restaurant to break even?
Monthly operational break-even and recovery of the initial investment are different milestones. Restaurants typically reach monthly operational break-even within 6 to 18 months, while breaking even on the initial investment is estimated to take 3 to 5 years. Treat these as broad planning benchmarks, not a timetable for an individual UAE restaurant. Trading days, sales, rent, labor, food costs, and the size of the original investment all influence timing.
How do you estimate labor savings and revenue gains from restaurant technology?
Establish a baseline using payroll records, staff hours, order corrections, and sales reports. After implementation, compare equivalent shifts and track whether reduced manual entry changes paid hours or lets staff handle other work. For revenue gains, measure additional orders or changes in average spend, then subtract associated variable costs. Count labour savings as cash savings only when expenses actually fall, and avoid counting the same benefit twice.
What is the break-even point formula for restaurant technology, and how do you calculate payback period and ROI?
Calculate technology break-even sales by dividing fixed costs, including the recurring technology expense, by the contribution margin ratio. Estimate payback period by dividing the investment cost by net benefit per period. For ROI, divide net benefit over the chosen period by investment cost, then multiply by 100. Count incremental contribution and realized savings, subtract recurring expenses, and use the same time period throughout each calculation.